get data for params$batch_value
source(here::here(glue::glue("{params$batch_name}/getData.R")))

df <- getData(params$batch_value)
[1] "getting data for Colored Dissolved Organic Matter"A rate of change is calculated for each station using a seasonal Mann Kendall slope calculation.
source(here::here(glue::glue("{params$batch_name}/getData.R")))
df <- getData(params$batch_value)[1] "getting data for Colored Dissolved Organic Matter"library(here)
library(lubridate) # for mdy_hms()
library(pander) # for display
library(dplyr) # for %>%
library(tidyr) # for unnest_wider
source(here("R/seasonalMannKendall.R"))
# add statistics for each station
sample_stats_df <- df %>%
group_by(ProgramName, ProgramLocationID, ParameterUnits) %>%
summarize(
AverageLatitude = mean(OriginalLatitude, na.rm = TRUE),
AverageLongitude = mean(OriginalLongitude, na.rm = TRUE),
mk_results = list(seasonalMannKendall(SampleDate, ResultValue)),
n_values = n(),
mean = mean(ResultValue, na.rm = TRUE),
min = as.numeric(min(ResultValue, na.rm = TRUE)),
max = as.numeric(max(ResultValue, na.rm = TRUE)),
coefficient.of.variation = sd(ResultValue, na.rm = TRUE) / mean(ResultValue, na.rm = TRUE),
.groups = 'drop'
)
# unnest the seasonal Mann Kendall results
sample_stats_df <- sample_stats_df %>%
tidyr::unnest_wider(mk_results)
sample_stats_df <- sample_stats_df %>%
mutate(
# create column significant_slope
significant_slope = ifelse(z <= 0.05, slope, NA_real_),
pvalue = z
) %>%
# drop unwanted columns added by seasonalMannKendall
select(
-z,
-tau,
-chi_square
)
# print(head(sample_stats_df))
# # display sample_stats_df with pander
# pander(sample_stats_df)dataDir <- here("data", "exports", params$batch_name)
# create dir if does not exist
if (!dir.exists(dataDir)) {
dir.create(dataDir)
}
# save file
sample_stats_df %>%
write.csv(paste0(dataDir, "/", params$batch_value, ".csv"))library(ggplot2)
ggplot(sample_stats_df, aes(x = slope)) +
geom_density(fill = "steelblue", linewidth=0.4, alpha = 0.3, bw = 0.001) +
geom_density(fill = "steelblue", linewidth=0.1, alpha = 0.1, bw = 0.01) +
geom_density(fill = "steelblue", linewidth=0.1, alpha = 0.1, bw = 0.1) +
geom_vline(xintercept = 0, linetype = "dashed", color = "gray")+
scale_y_continuous(trans = "sqrt") +
labs(title = "Density of Site Slopes",
x = "Slope (rate of change)",
y = "Density") +
theme_minimal()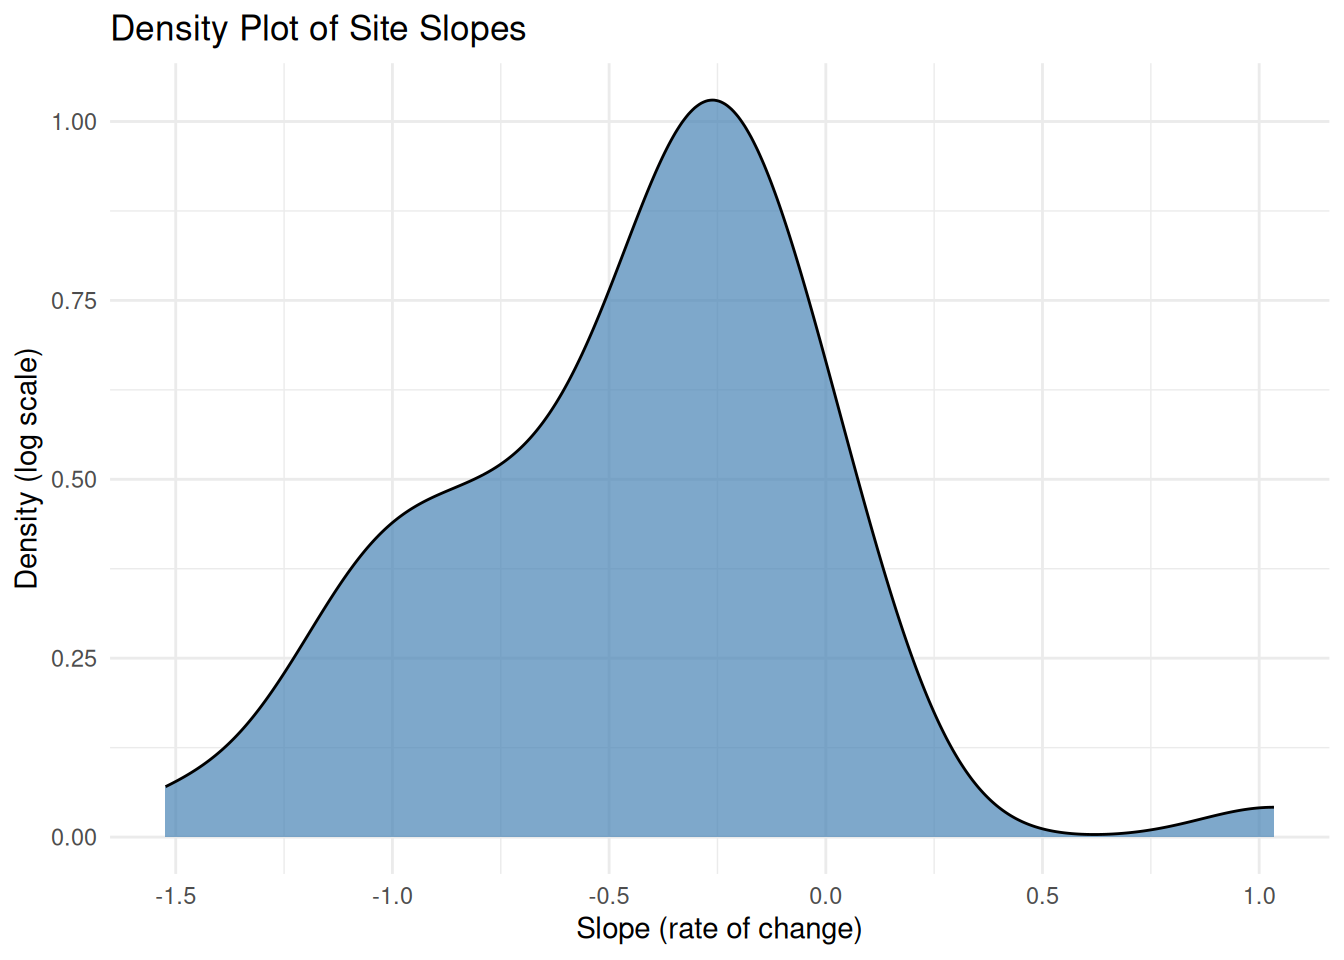
library(gt)
library(scales)
library(tidyselect)  # for all_of()
library(RColorBrewer) # for brewer.pal()

# ── color_column() ─────────────────────────────────────────────────────────────
# gt_tbl   : a gt object that you’ve already created (e.g. `sample_stats_df %>% gt()`)
# df       : the original data.frame (must contain the column you want to color)
# column   : a string, e.g. "slope" or "n_values"
# palette  : a character vector of colours to feed to col_numeric()
#
color_column <- function(gt_tbl, df, column,
                         palette = c("red", "orange", "yellow", "green", "blue", "violet"),
                         domain = NULL) {
  # 1) Pull out that column’s numeric values
  vals <- df[[column]]
  if (!is.numeric(vals)) {
    stop(sprintf("`%s` is not numeric; data_color() requires a numeric column.", column))
  }

  # 2) Compute its min and max (ignoring NA)
  min_val <- min(vals, na.rm = TRUE)
  max_val <- max(vals, na.rm = TRUE)
  if (is.null(domain)) {
    domain <- c(min_val, max_val)
  }

  # 3) Call data_color() on the gt table for that single column
  gt_tbl %>%
    data_color(
      columns = all_of(column),
      colors  = col_numeric(
        palette = palette,
        domain  = domain
      )
    )
}
library(dplyr)
library(gt)

# 1) First build your gt table as usual:
gt_tbl <- sample_stats_df %>%
  gt()

# slope blue (-) to red (+) (0 centered)
tryCatch({
  min_slope <- min(sample_stats_df$slope,  na.rm = TRUE)
  max_slope <- max(sample_stats_df$slope,  na.rm = TRUE)
  max_abs_slope <- max(abs(min_slope), abs(max_slope))
  gt_tbl <- color_column(
    gt_tbl,
    df     = sample_stats_df,
    column = "slope",
    palette = rev(brewer.pal(11, "RdBu")),
    domain  = c(-max_abs_slope, max_abs_slope)
  )
}, error = function(e) {
  print("Error in slope color column")
  print(e)
})

# slope blue (-) to red (+) (0 centered)
tryCatch({
  min_slope <- min(sample_stats_df$significant_slope,  na.rm = TRUE)
  max_slope <- max(sample_stats_df$significant_slope,  na.rm = TRUE)
  max_abs_slope <- max(abs(min_slope), abs(max_slope))
  gt_tbl <- color_column(
    gt_tbl,
    df     = sample_stats_df,
    column = "significant_slope",
    palette = rev(brewer.pal(11, "RdBu")),
    domain  = c(-max_abs_slope, max_abs_slope)
  )
}, error = function(e) {
  print("Error in significant_slope color column")
  print(e)
})

tryCatch({
  # mean values blue to red (0 centered)
  min_mean <- min(sample_stats_df$mean,  na.rm = TRUE)
  max_mean <- max(sample_stats_df$mean,  na.rm = TRUE)
  max_abs_mean <- max(abs(min_mean), abs(max_mean))
  gt_tbl <- color_column(
    gt_tbl,
    df     = sample_stats_df,
    column = "mean",
    palette = rev(brewer.pal(11, "RdBu")),
    domain  = c(-max_abs_mean, max_abs_mean)
  )
}, error = function(e) {
  print("Error in mean color column")
  print(e)
})

tryCatch({
  # n values white to green
  gt_tbl <- color_column(
    gt_tbl,
    df      = sample_stats_df,
    column  = "n_values",
    palette = scales::brewer_pal(palette = "Greens")(9)
  )
}, error = function(e) {
  print("Error in n_values color column")
  print(e)
})

tryCatch({
  # min
  gt_tbl <- color_column(
    gt_tbl,
    df      = sample_stats_df,
    column  = "min",
    palette = scales::brewer_pal(palette = "Blues")(9)
  )
}, error = function(e) {
  print("Error in min color column")
  print(e)
})

tryCatch({
  # max
  gt_tbl <- color_column(
    gt_tbl,
    df      = sample_stats_df,
    column  = "max",
    palette = scales::brewer_pal(palette = "Blues")(9)
  )
}, error = function(e) {
  print("Error in max color column")
  print(e)
})

tryCatch({
  # coefficient.of.variation
  gt_tbl <- color_column(
    gt_tbl,
    df      = sample_stats_df,
    column  = "coefficient.of.variation",
    palette = scales::brewer_pal(palette = "Blues")(9)
  )
}, error = function(e) {
  print("Error in coefficient.of.variation color column")
  print(e)
})

# 4) Render/display:
gt_tbl| ProgramName | ProgramLocationID | ParameterUnits | AverageLatitude | AverageLongitude | slope | n_values | mean | min | max | coefficient.of.variation | significant_slope | pvalue |
|---|---|---|---|---|---|---|---|---|---|---|---|---|
| Atlantic Oceanographic and Meteorological Laboratory (AOML) South Florida Program Synoptic Shipboard Surveys | 1 | PCU | 25.41024 | -80.31363 | -0.3058166667 | 68 | 16.883662 | 0.000 | 43.363 | 0.4910093 | NA | 0.280530900 |
| Atlantic Oceanographic and Meteorological Laboratory (AOML) South Florida Program Synoptic Shipboard Surveys | 10 | PCU | 24.93983 | -80.92481 | -0.9614000000 | 67 | 23.599627 | 0.323 | 55.961 | 0.4488004 | -0.9614000 | 0.045999021 |
| Atlantic Oceanographic and Meteorological Laboratory (AOML) South Florida Program Synoptic Shipboard Surveys | 11 | PCU | 24.90527 | -80.91957 | -1.1330000000 | 67 | 19.527657 | 0.101 | 42.548 | 0.4454291 | -1.1330000 | 0.002274799 |
| Atlantic Oceanographic and Meteorological Laboratory (AOML) South Florida Program Synoptic Shipboard Surveys | 12 | PCU | 24.89959 | -80.94092 | -0.9401818182 | 67 | 25.409866 | 0.267 | 51.199 | 0.4500360 | NA | 0.127035799 |
| Atlantic Oceanographic and Meteorological Laboratory (AOML) South Florida Program Synoptic Shipboard Surveys | 13 | PCU | 24.89657 | -81.06128 | -0.7427375000 | 66 | 22.412591 | 0.434 | 57.760 | 0.5445383 | NA | 0.082347876 |
| Atlantic Oceanographic and Meteorological Laboratory (AOML) South Florida Program Synoptic Shipboard Surveys | 14 | PCU | 24.85157 | -81.02604 | -0.4218482143 | 66 | 15.035864 | 1.212 | 60.259 | 0.6622946 | NA | 0.063306726 |
| Atlantic Oceanographic and Meteorological Laboratory (AOML) South Florida Program Synoptic Shipboard Surveys | 15 | PCU | 24.77961 | -80.98455 | -0.2381883117 | 66 | 12.464545 | 0.267 | 36.862 | 0.6119738 | NA | 0.375651673 |
| Atlantic Oceanographic and Meteorological Laboratory (AOML) South Florida Program Synoptic Shipboard Surveys | 16 | PCU | 24.76750 | -81.02738 | -0.1538989899 | 66 | 14.680636 | 0.045 | 149.025 | 1.2618396 | NA | 0.436124058 |
| Atlantic Oceanographic and Meteorological Laboratory (AOML) South Florida Program Synoptic Shipboard Surveys | 17 | PCU | 24.77255 | -80.96101 | -0.2532500000 | 65 | 9.431369 | 0.076 | 34.383 | 0.7307403 | NA | 0.540544333 |
| Atlantic Oceanographic and Meteorological Laboratory (AOML) South Florida Program Synoptic Shipboard Surveys | 18 | PCU | 24.77380 | -80.91780 | -0.3320000000 | 65 | 7.681785 | 0.073 | 15.429 | 0.4764746 | NA | 0.057337131 |
| Atlantic Oceanographic and Meteorological Laboratory (AOML) South Florida Program Synoptic Shipboard Surveys | 19 | PCU | 24.80966 | -81.00241 | -0.2408958333 | 66 | 11.636242 | 0.000 | 52.608 | 0.6049585 | NA | 0.208395798 |
| Atlantic Oceanographic and Meteorological Laboratory (AOML) South Florida Program Synoptic Shipboard Surveys | 2 | PCU | 25.41282 | -80.32572 | -0.7256875000 | 68 | 18.776735 | 0.128 | 55.686 | 0.5370080 | -0.7256875 | 0.044007047 |
| Atlantic Oceanographic and Meteorological Laboratory (AOML) South Florida Program Synoptic Shipboard Surveys | 20 | PCU | 24.80362 | -80.98710 | -0.2519222222 | 64 | 10.997938 | 0.267 | 29.484 | 0.4568682 | NA | 0.490636141 |
| Atlantic Oceanographic and Meteorological Laboratory (AOML) South Florida Program Synoptic Shipboard Surveys | 21 | PCU | 24.87484 | -80.88658 | -0.2310000000 | 65 | 12.151538 | 0.000 | 43.126 | 0.5391759 | NA | 0.202353370 |
| Atlantic Oceanographic and Meteorological Laboratory (AOML) South Florida Program Synoptic Shipboard Surveys | 22 | PCU | 24.75557 | -81.25722 | -0.6580000000 | 65 | 13.138862 | 0.184 | 42.923 | 0.5216171 | -0.6580000 | 0.029147611 |
| Atlantic Oceanographic and Meteorological Laboratory (AOML) South Florida Program Synoptic Shipboard Surveys | 23 | PCU | 24.75194 | -81.26681 | -0.2914444444 | 65 | 14.217446 | 0.000 | 43.262 | 0.5117157 | NA | 0.225536978 |
| Atlantic Oceanographic and Meteorological Laboratory (AOML) South Florida Program Synoptic Shipboard Surveys | 24 | PCU | 24.78335 | -81.28412 | -0.1528888889 | 64 | 16.501781 | 0.073 | 43.704 | 0.4797157 | NA | 0.460463934 |
| Atlantic Oceanographic and Meteorological Laboratory (AOML) South Florida Program Synoptic Shipboard Surveys | 25 | PCU | 24.83377 | -81.41273 | -0.7523125000 | 65 | 23.470231 | 0.323 | 53.872 | 0.4804131 | NA | 0.366582209 |
| Atlantic Oceanographic and Meteorological Laboratory (AOML) South Florida Program Synoptic Shipboard Surveys | 26 | PCU | 24.85346 | -81.37915 | -0.4200000000 | 64 | 21.032375 | 0.045 | 51.101 | 0.4970035 | NA | 0.389184629 |
| Atlantic Oceanographic and Meteorological Laboratory (AOML) South Florida Program Synoptic Shipboard Surveys | 27 | PCU | 24.86979 | -81.40956 | -0.4334000000 | 64 | 21.652562 | 0.378 | 47.845 | 0.5002435 | NA | 0.712096743 |
| Atlantic Oceanographic and Meteorological Laboratory (AOML) South Florida Program Synoptic Shipboard Surveys | 28 | PCU | 24.90185 | -81.49701 | -0.1818750000 | 64 | 24.221187 | 0.490 | 49.595 | 0.4730671 | NA | 0.538508971 |
| Atlantic Oceanographic and Meteorological Laboratory (AOML) South Florida Program Synoptic Shipboard Surveys | 29 | PCU | 25.02244 | -81.43426 | -1.0150476190 | 65 | 25.806138 | 0.490 | 56.690 | 0.4803962 | NA | 0.062044063 |
| Atlantic Oceanographic and Meteorological Laboratory (AOML) South Florida Program Synoptic Shipboard Surveys | 3 | PCU | 25.40010 | -80.34841 | -0.2330500000 | 68 | 18.868353 | 0.073 | 77.187 | 0.5870526 | NA | 0.185668732 |
| Atlantic Oceanographic and Meteorological Laboratory (AOML) South Florida Program Synoptic Shipboard Surveys | 30 | PCU | 25.19548 | -81.54415 | -0.8151714286 | 65 | 22.835923 | 0.490 | 62.425 | 0.4909733 | NA | 0.104118030 |
| Atlantic Oceanographic and Meteorological Laboratory (AOML) South Florida Program Synoptic Shipboard Surveys | 31 | PCU | 25.39761 | -81.43758 | -1.0980000000 | 65 | 26.889308 | 0.378 | 70.250 | 0.4875921 | NA | 0.080881374 |
| Atlantic Oceanographic and Meteorological Laboratory (AOML) South Florida Program Synoptic Shipboard Surveys | 32 | PCU | 25.47344 | -81.41248 | -1.0663571429 | 64 | 23.096781 | 0.120 | 64.223 | 0.5304060 | NA | 0.094038478 |
| Atlantic Oceanographic and Meteorological Laboratory (AOML) South Florida Program Synoptic Shipboard Surveys | 33 | PCU | 25.50204 | -81.38007 | -1.5236458333 | 64 | 24.792109 | 0.573 | 60.870 | 0.4804925 | -1.5236458 | 0.003558980 |
| Atlantic Oceanographic and Meteorological Laboratory (AOML) South Florida Program Synoptic Shipboard Surveys | 34 | PCU | 25.50814 | -81.39526 | -0.6720000000 | 62 | 15.907903 | 3.491 | 39.583 | 0.5455627 | NA | 0.088508829 |
| Atlantic Oceanographic and Meteorological Laboratory (AOML) South Florida Program Synoptic Shipboard Surveys | 35 | PCU | 25.14907 | -81.01582 | -0.5073333333 | 64 | 19.186172 | 0.323 | 45.269 | 0.4825404 | NA | 0.121037339 |
| Atlantic Oceanographic and Meteorological Laboratory (AOML) South Florida Program Synoptic Shipboard Surveys | 36 | PCU | 25.12738 | -80.94329 | -0.5772777778 | 65 | 22.489169 | 0.212 | 51.004 | 0.4801898 | NA | 0.433916059 |
| Atlantic Oceanographic and Meteorological Laboratory (AOML) South Florida Program Synoptic Shipboard Surveys | 37 | PCU | 25.12713 | -80.95047 | -0.3142500000 | 64 | 18.039313 | 0.434 | 45.026 | 0.5685455 | NA | 0.664200162 |
| Atlantic Oceanographic and Meteorological Laboratory (AOML) South Florida Program Synoptic Shipboard Surveys | 38 | PCU | 25.15951 | -80.89945 | -0.5881388889 | 64 | 14.289719 | 0.184 | 39.243 | 0.5464146 | NA | 0.153753073 |
| Atlantic Oceanographic and Meteorological Laboratory (AOML) South Florida Program Synoptic Shipboard Surveys | 39 | PCU | 25.40518 | -81.07608 | -0.3720888889 | 64 | 12.593172 | 0.184 | 32.225 | 0.5149897 | NA | 0.420112680 |
| Atlantic Oceanographic and Meteorological Laboratory (AOML) South Florida Program Synoptic Shipboard Surveys | 4 | PCU | 25.12019 | -80.52974 | -0.4438000000 | 68 | 24.258941 | 0.017 | 47.699 | 0.4071041 | NA | 0.074448116 |
| Atlantic Oceanographic and Meteorological Laboratory (AOML) South Florida Program Synoptic Shipboard Surveys | 40 | PCU | 25.41633 | -81.09621 | -0.2264166667 | 64 | 10.970422 | 0.184 | 26.704 | 0.4264935 | NA | 0.153753073 |
| Atlantic Oceanographic and Meteorological Laboratory (AOML) South Florida Program Synoptic Shipboard Surveys | 5 | PCU | 25.10463 | -80.53855 | -0.8430000000 | 67 | 28.054851 | 0.128 | 72.915 | 0.4572195 | NA | 0.158977366 |
| Atlantic Oceanographic and Meteorological Laboratory (AOML) South Florida Program Synoptic Shipboard Surveys | 6 | PCU | 25.06735 | -80.53613 | -0.5316666667 | 65 | 29.461338 | 0.212 | 56.788 | 0.4155379 | NA | 0.468755176 |
| Atlantic Oceanographic and Meteorological Laboratory (AOML) South Florida Program Synoptic Shipboard Surveys | 7 | PCU | 24.96683 | -80.77413 | -0.3364444444 | 67 | 38.138761 | 0.406 | 81.975 | 0.4564233 | NA | 0.557282270 |
| Atlantic Oceanographic and Meteorological Laboratory (AOML) South Florida Program Synoptic Shipboard Surveys | 8 | PCU | 24.95060 | -80.79947 | -1.1720000000 | 67 | 32.629119 | 0.684 | 64.175 | 0.4142380 | -1.1720000 | 0.045999021 |
| Atlantic Oceanographic and Meteorological Laboratory (AOML) South Florida Program Synoptic Shipboard Surveys | 9 | PCU | 24.93791 | -80.81166 | -1.3021666667 | 67 | 31.908060 | 0.740 | 67.966 | 0.4182612 | -1.3021667 | 0.004846871 |
| Atlantic Oceanographic and Meteorological Laboratory (AOML) South Florida Program Synoptic Shipboard Surveys | B1 | PCU | 25.73919 | -80.18311 | -0.3510500000 | 53 | 16.620226 | 0.573 | 86.278 | 0.7638057 | NA | 0.579198994 |
| Atlantic Oceanographic and Meteorological Laboratory (AOML) South Florida Program Synoptic Shipboard Surveys | B10 | PCU | 25.29705 | -80.36151 | 0.1244571429 | 53 | 19.404264 | 0.201 | 53.028 | 0.5159918 | NA | 0.938380746 |
| Atlantic Oceanographic and Meteorological Laboratory (AOML) South Florida Program Synoptic Shipboard Surveys | B11 | PCU | 25.23872 | -80.37595 | 0.0108750000 | 52 | 18.891981 | 0.323 | 35.280 | 0.4114267 | NA | 0.875265790 |
| Atlantic Oceanographic and Meteorological Laboratory (AOML) South Florida Program Synoptic Shipboard Surveys | B12 | PCU | 25.25572 | -80.42246 | -0.8930000000 | 52 | 35.486750 | 0.628 | 71.486 | 0.4016902 | NA | 0.271849206 |
| Atlantic Oceanographic and Meteorological Laboratory (AOML) South Florida Program Synoptic Shipboard Surveys | B13 | PCU | 25.17490 | -80.42324 | -0.4700000000 | 52 | 21.151808 | 0.101 | 41.492 | 0.3694753 | NA | 0.271849206 |
| Atlantic Oceanographic and Meteorological Laboratory (AOML) South Florida Program Synoptic Shipboard Surveys | B14 | PCU | 25.46780 | -80.21336 | -0.0140000000 | 52 | 8.405423 | 0.184 | 138.152 | 2.2215494 | NA | 1.000000000 |
| Atlantic Oceanographic and Meteorological Laboratory (AOML) South Florida Program Synoptic Shipboard Surveys | B15 | PCU | 25.58023 | -80.19836 | -0.0351666667 | 52 | 6.570385 | 0.212 | 19.554 | 0.6878644 | NA | 0.812139784 |
| Atlantic Oceanographic and Meteorological Laboratory (AOML) South Florida Program Synoptic Shipboard Surveys | B16 | PCU | 25.66213 | -80.18718 | -0.0218833333 | 52 | 10.750731 | 0.101 | 84.750 | 1.2528395 | NA | 0.935211985 |
| Atlantic Oceanographic and Meteorological Laboratory (AOML) South Florida Program Synoptic Shipboard Surveys | B17 | PCU | 25.61505 | -80.29133 | 1.0341000000 | 35 | 23.147229 | 0.545 | 77.089 | 0.6395636 | NA | 0.896706705 |
| Atlantic Oceanographic and Meteorological Laboratory (AOML) South Florida Program Synoptic Shipboard Surveys | B2 | PCU | 25.69038 | -80.24794 | 0.1460000000 | 53 | 24.874642 | 0.351 | 85.155 | 0.5646763 | NA | 0.872914671 |
| Atlantic Oceanographic and Meteorological Laboratory (AOML) South Florida Program Synoptic Shipboard Surveys | B3 | PCU | 25.65428 | -80.26368 | 0.0002777778 | 52 | 33.560173 | 0.684 | 126.281 | 0.7544195 | NA | 1.000000000 |
| Atlantic Oceanographic and Meteorological Laboratory (AOML) South Florida Program Synoptic Shipboard Surveys | B4 | PCU | 25.59146 | -80.26372 | -0.1540333333 | 51 | 9.486725 | 0.101 | 26.024 | 0.5618077 | NA | 0.934634799 |
| Atlantic Oceanographic and Meteorological Laboratory (AOML) South Florida Program Synoptic Shipboard Surveys | B5 | PCU | 25.53003 | -80.31391 | -1.0118571429 | 53 | 36.193623 | 0.795 | 108.629 | 0.6269206 | NA | 0.749032993 |
| Atlantic Oceanographic and Meteorological Laboratory (AOML) South Florida Program Synoptic Shipboard Surveys | B6 | PCU | 25.49237 | -80.25184 | -0.1056250000 | 52 | 7.218231 | 0.017 | 20.542 | 0.6380195 | NA | 0.807333428 |
| Atlantic Oceanographic and Meteorological Laboratory (AOML) South Florida Program Synoptic Shipboard Surveys | B7 | PCU | 25.46321 | -80.32531 | -0.2076000000 | 53 | 20.840472 | 0.351 | 61.004 | 0.6680065 | NA | 0.522283516 |
| Atlantic Oceanographic and Meteorological Laboratory (AOML) South Florida Program Synoptic Shipboard Surveys | B8 | PCU | 25.40512 | -80.24347 | 0.0368714286 | 52 | 6.544481 | 0.017 | 23.867 | 0.6745346 | NA | 0.807333428 |
| Atlantic Oceanographic and Meteorological Laboratory (AOML) South Florida Program Synoptic Shipboard Surveys | B9 | PCU | 25.33333 | -80.32137 | -0.0521666667 | 52 | 13.906173 | 0.239 | 48.378 | 0.6363270 | NA | 0.937884809 |